
Menlo Ventures 2026 Enterprise AI Report: Chinese Models Are 89% of Open-Source Spend, and Open Source Is Only 4% of Model Spend
"Chinese models took 89% of open source" is a share of open-source spend, not global and not users; open source is only 4% of model spend. All numbers come from the Menlo report itself, survey-weighted estimates for U.S. enterprises.
 bufferAbout the author5 min read
Short answer: on November 3, 2026, Menlo Ventures published “2026: The State of Enterprise AI.” The line that spread fastest in Chinese-language feeds is “Chinese models took 89% of open source.” It is quoted correctly but easy to misread: 89% is a share of *open-source model spend*, not global and not users. Open source as a whole is only 4% of model spend (while being 19% of tokens). Usage went up; money did not follow. One more thing: Kimi 61%, DeepSeek 15%, GLM 11% and Qwen 3% add up to 90%, yet the report’s total says 89%. That may be rounding, but the report does not explain it and we cannot confirm it. Every number below comes from the report itself; we checked it against the original on November 10, 2026.
What the report actually measures
Get the method right first, or every number after it will be misread.
- The survey covers nearly 400 U.S. enterprise decision-makers responsible for more than $4 billion in AI spending, fielded by Morning Consult from September 8 to 26, 2026.
- Per-model spend shares are estimates: respondents reported the share of their AI workloads running on each model, weighted by AI spend. Total market size is Menlo’s own bottoms-up estimate, informed by the survey, public filings and third-party reports.
- So these are survey-weighted estimates for U.S. enterprises. Not global, not Chinese users, and not revenue reported by the companies.
- Companies marked with an asterisk in the report are Menlo portfolio companies, and Anthropic is one of them. Worth keeping in mind while reading.
What the “4%” really is
The 4% is open-source models’ share of model spend. It is not a share of users and not a share of tokens. The report’s comparison:
| Metric | Sep 2025 | Sep 2026 |
|---|---|---|
| Open-source share of tokens | 11% | 19% |
| Open-source share of model spend | 6% | 4% |
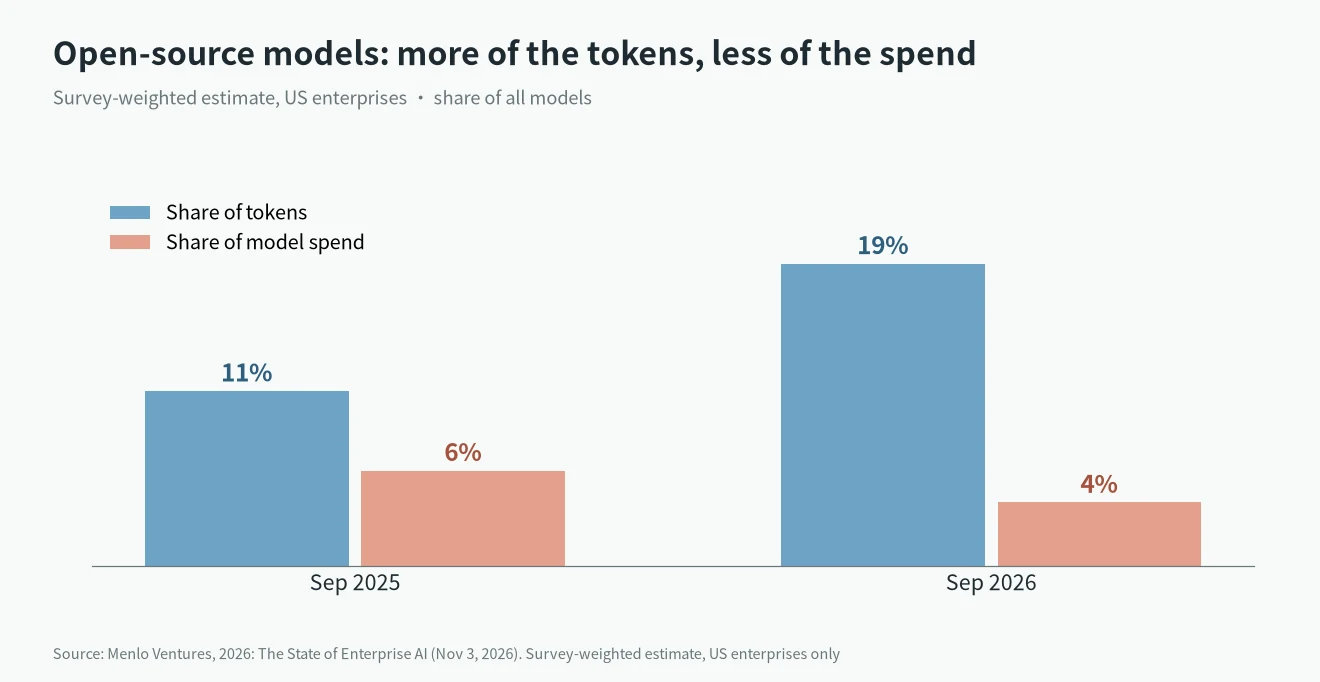
Why more tokens but less money? The report points to prices falling faster: the average open-source token got 3.3x cheaper, to about $0.13 per million tokens, while the blended closed-model token price fell 24%, to $0.70 per million. The same section says open-source volume grew 22.5x to an estimated 2.9 quadrillion tokens a month, versus 12.1x for closed models. In the report’s words, open source now handles about one in five tokens but accounts for about one in 25 dollars of model spend.
What the “89%” really is
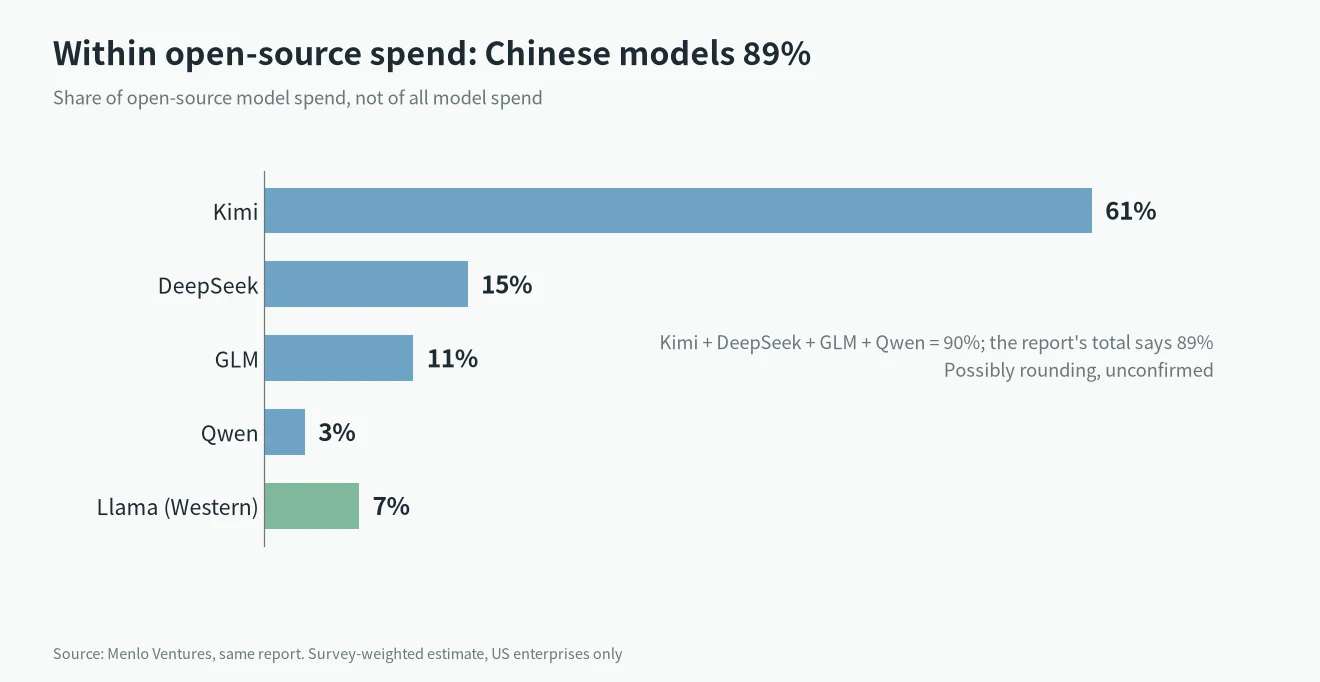
The report says Chinese models grew to 89% of open-source spend: Kimi 61%, DeepSeek 15%, GLM 11%, Qwen 3%. Meta’s Llama is the most popular Western open-source model at 7%.
Why four items add up to 90% but the total says 89%
61 + 15 + 11 + 3 = 90, while the report’s total is 89. It may be caused by rounding each item separately, but the page shows no decimals and no footnote, so this is only a guess and we cannot confirm it. Practical reading: treat these as rough proportions, not exact values, and do not build two-decimal math on them.
The 4 most common misreadings
- Reading it as global. The survey covers U.S. enterprise decision-makers only. Some Chinese-language retellings wrote “global”; the report does not.
- Reading it as users. 4% is a spend share. More people using something does not mean more dollars. Cheap open-source tokens are exactly why 19% of usage brings only 4% of spend.
- Reading it as “Chinese models are 89% of all model spend.” The denominator of 89% is open-source spend, and open source is 4% of the total. In the same report the big enterprise LLM API money sits elsewhere, see the table below.
- Reading it as an exact count. Spend shares are estimates, and the parts differ from the total by one point.
Other numbers from the same report
Share of enterprise LLM API spend (report estimates):
| Provider | 2025 | 2026 |
|---|---|---|
| Anthropic | 40% | 55% |
| OpenAI | 27% | 31% |
| 21% | 9% |
The report says Anthropic and OpenAI together hold 86% of enterprise LLM API spend (67% last year). xAI’s Grok 4.7 and open-source models such as Kimi K3, DeepSeek V4 and GLM-5.3 approach frontier performance at a fraction of the price, but together hold just under 5% of LLM API spend. Overall, Menlo estimates enterprise AI deployment spend reached $176.8B by September 2026, 5.4x last year. For the stock side, see Anthropic IPO: how to buy.
What it means if you use Chinese models (our view)
This part is our judgment, not the report’s conclusion.
- Open-source tokens are cheap, so “high usage, low spend” is plausible. Good for buyers, but it tells you nothing about how much those labs earn.
- The report’s framing for enterprise buyers is that money follows capability, with price not the deciding factor. Cheap does not mean widely bought.
- To plug Chinese models into Claude Code, see DeepSeek API for Claude Code; for Kimi pricing and China access, see Kimi K3.1 Pro API pricing.
- To compare official API prices, use LLM API pricing comparison; to run open models on your own machine, see best local LLM by VRAM.
FAQ
Can I multiply 89% by 4%?
The report does not give a “Chinese models as a share of all model spend” figure. Both numbers are estimates and the parts are one point off the total, so we do not compute one, and we do not recommend quoting a new number you derived yourself.
Does Kimi 61% mean 61% of all model spend?
No. 61% is Kimi’s share of open-source model spend.
Is this global data?
No. Respondents are AI decision-makers at U.S. enterprises.
Where do the numbers come from?
All of them from the original Menlo Ventures report (November 3, 2026; authors Tim Tully, Joff Redfern, Deedy Das, Derek Xiao). This article adds no numbers from outside the report.